The Where and When of Hay Fever
Charlotte, December 2018. Allergic rhinitis (or hay fever) effects roughly 15 out of 100 Americans, but sufferers have had little guidance on how to avoid the pollen outbreaks that aggrevate thier symptoms. Blooms of trees, grasses and herbaceous plants are to blame, but seasonality and variations in climate have made it hard to understand where it will be, and how long it will last. Add to that the low density of pollen count monitoring, and you have a situation that blind-sides the allergic every year.
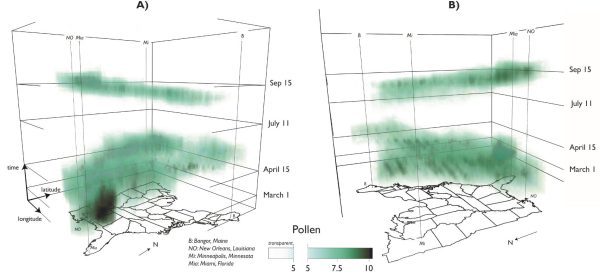
CAGIS researchers Michael Desjardin, Alexander Hohl, Adam Griffith and Faculty Associate Eric Delmelle have cast new light on this problem using 3D visualizations and interpolations that estimate pollen outbreaks in areas without monitoring. In the journal Cartography and Geographic Information Science, the team examined the dynamics of pollen in the eastern United States over the course of 2016. The paper’s highlights include: (1) extracting daily pollen counts for select zip codes in the Eastern United States in 2016; (2) interpolating (estimating) the pollen counts in areas that did not have observations with a space-time estimation algorithm; (3) utilizing parallel computing technology to perform the space-time estimation (i.e. use multiple computers to run the model, minimizing computation time); (4) and visualizing the results in both 2D and 3D to understand the variation and seasonality of pollen levels. The methodological approaches in this paper are generalizable to other environmental applications, such as air pollution, ash clouds, and precipitation. These 2016 results can then be compared with other annual datasets to identify changes (especially increases) in pollen season intensity and duration, which may correspond to climate change and global warming.
Desjardins, M. R., Hohl, A., Griffith, A., & Delmelle, E. (2018). A space–time parallel framework for fine-scale visualization of pollen levels across the Eastern United States. Cartography and Geographic Information Science, 1-13.
Link: https://www.tandfonline.com/doi/full/10.1080/15230406.2018.1515664